 "
"
File:Fig3.jpeg
From 2012hs.igem.org
(Difference between revisions)
(This chart shows the arsenic levels in soil and groundwater around the United Staes. As can be seen, the arsenic levels around Seattle are rather high.) |
(uploaded a new version of "File:Fig3.jpeg") |
Latest revision as of 20:44, 18 May 2012
This chart shows the arsenic levels in soil and groundwater around the United Staes. As can be seen, the arsenic levels around Seattle are rather high.
File history
Click on a date/time to view the file as it appeared at that time.
| Date/Time | Thumbnail | Dimensions | User | Comment | |
|---|---|---|---|---|---|
| current | 20:44, 18 May 2012 | 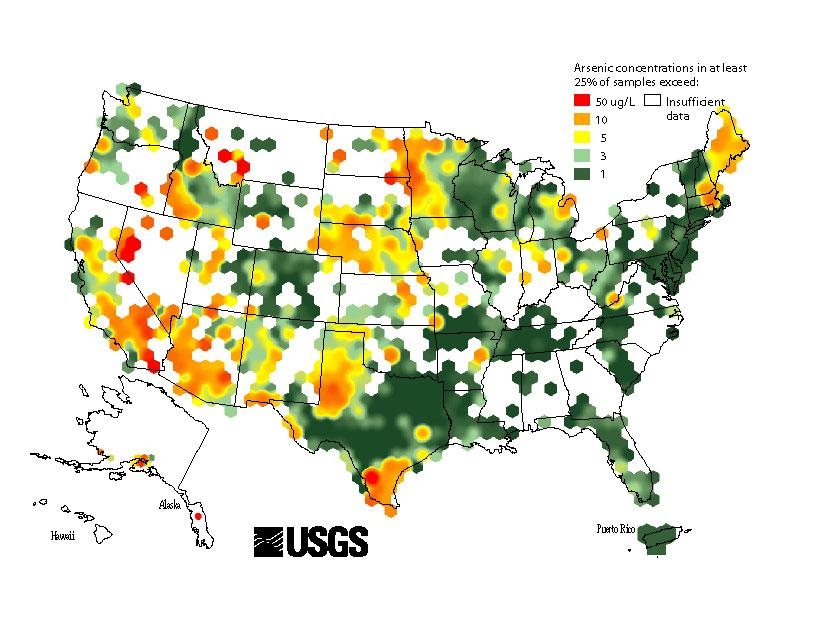 | 815×629 (82 KB) | ShadowsAndRegrets (Talk | contribs) | |
| 20:42, 18 May 2012 |  | 815×629 (82 KB) | ShadowsAndRegrets (Talk | contribs) | (This chart shows the arsenic levels in soil and groundwater around the United Staes. As can be seen, the arsenic levels around Seattle are rather high.) |
File links
There are no pages that link to this file.