 "
"
File:Fig3.jpeg
From 2012hs.igem.org
Size of this preview: 777 × 600 pixels
Full resolution (815 × 629 pixels, file size: 82 KB, MIME type: image/jpeg)
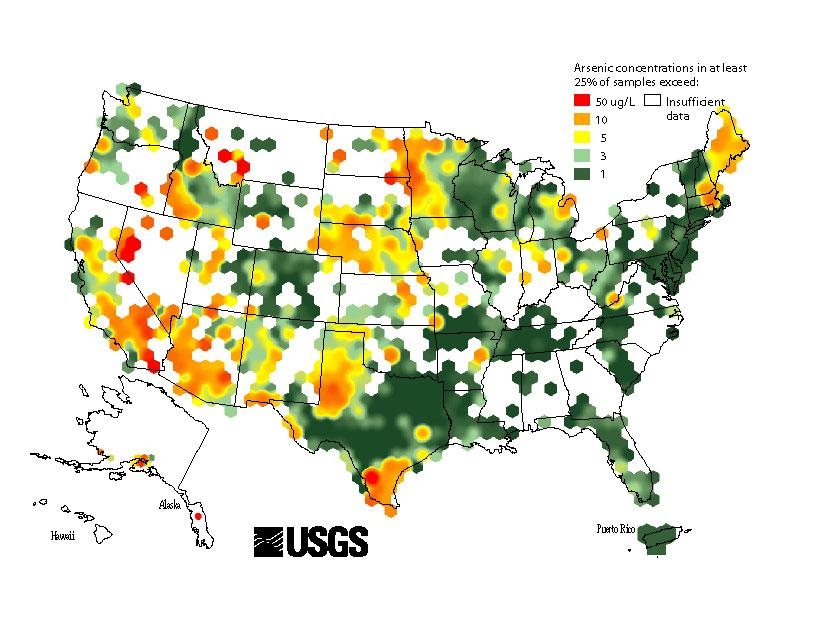
This chart shows the arsenic levels in soil and groundwater around the United Staes. As can be seen, the arsenic levels around Seattle are rather high.
File history
Click on a date/time to view the file as it appeared at that time.
| Date/Time | Thumbnail | Dimensions | User | Comment | |
|---|---|---|---|---|---|
| current | 20:44, 18 May 2012 | | 815×629 (82 KB) | ShadowsAndRegrets (Talk | contribs) | |
| 20:42, 18 May 2012 |  | 815×629 (82 KB) | ShadowsAndRegrets (Talk | contribs) | (This chart shows the arsenic levels in soil and groundwater around the United Staes. As can be seen, the arsenic levels around Seattle are rather high.) |
File links
There are no pages that link to this file.